66%
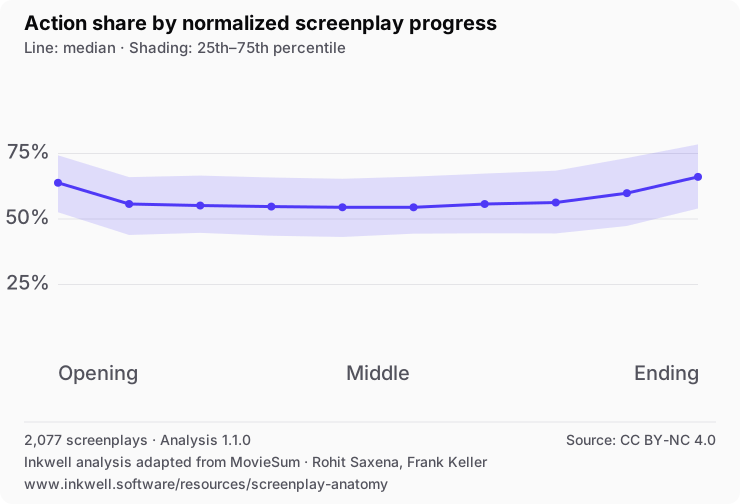
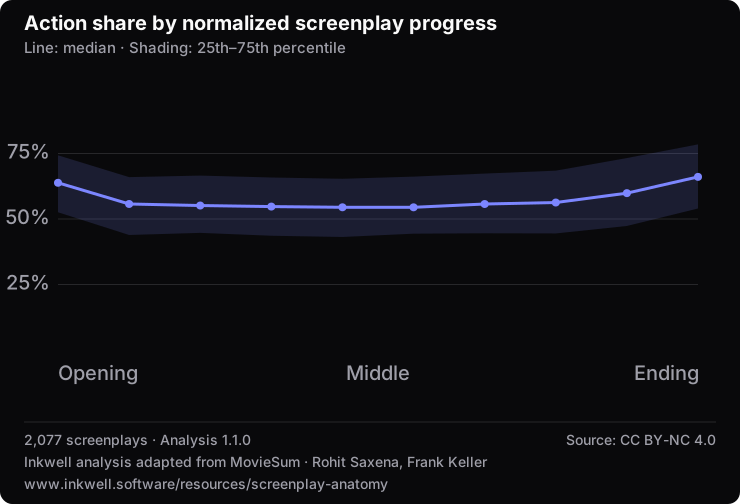
The final tenth is more action-heavy
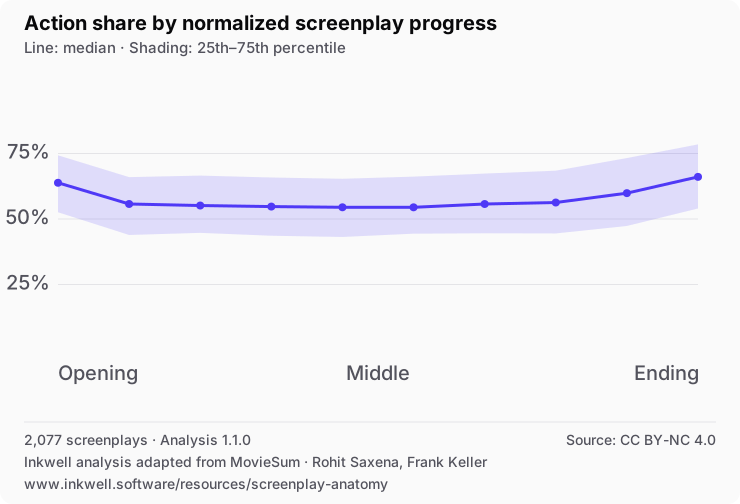
The median rises from 54% action around the midpoint to 66% at the ending. Dialogue is the complement.
Screenplay Anatomy Atlas · August 2026
We normalized 2,077 structured screenplays from first scene to last, then measured what changed: action and dialogue balance, scene rhythm, speaking-character arrivals, and who carries the dialogue. These are corpus patterns—not instructions for where your story must turn.
What is actually in here? The included files range from Alien, Chinatown, Fargo, Inception, Moonlight, Parasite, and Whiplash to more than 2,000 other scripts. These are archived screenplay versions—not claims about the final cut or shooting draft.
Three findings first
Every headline below is paired with its distribution later in the atlas. None of the figures identifies a “correct” screenplay or separates produced films from unproduced drafts.
The median rises from 54% action around the midpoint to 66% at the ending. Dialogue is the complement.
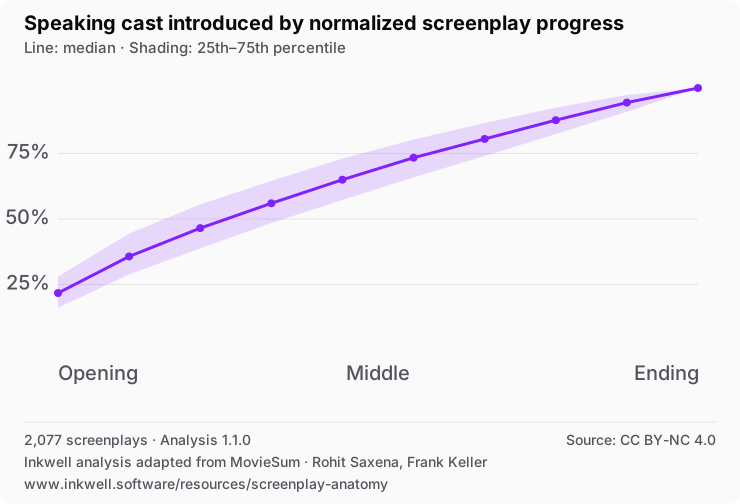
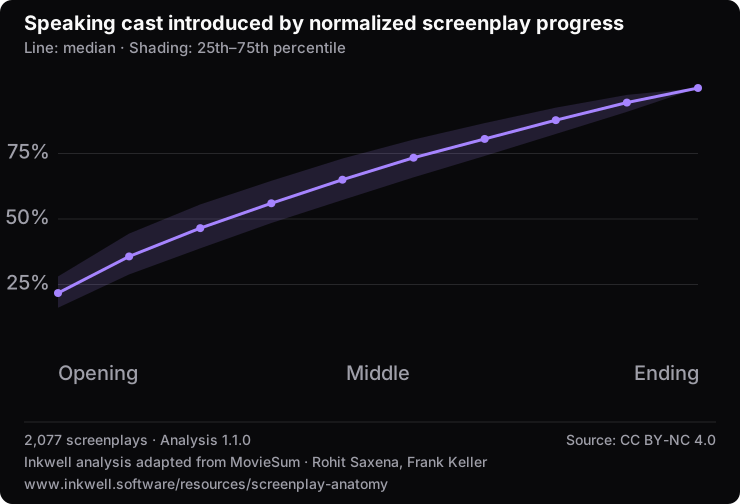
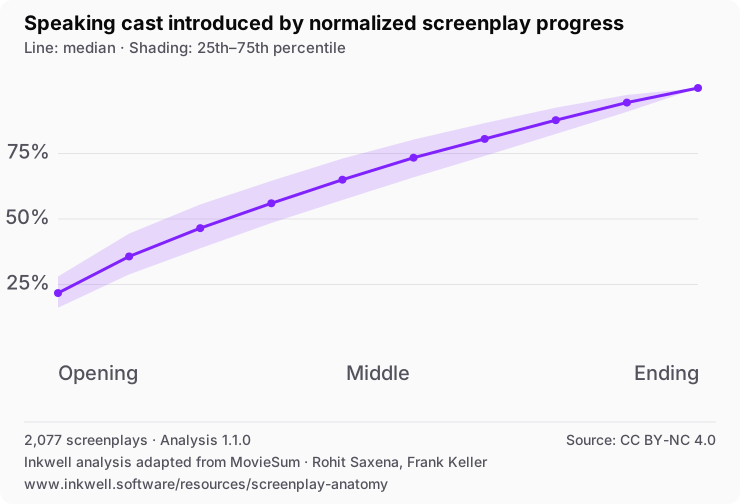
Only 22% of the eventual speaking cast appears in the opening tenth; the median reaches 65% by halfway.
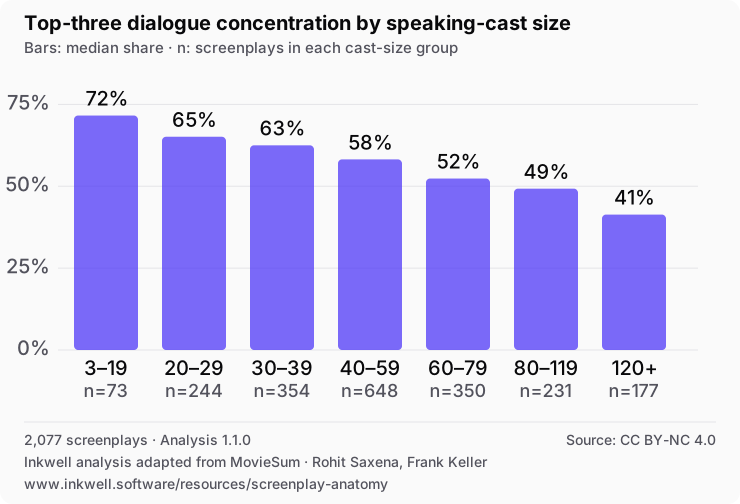
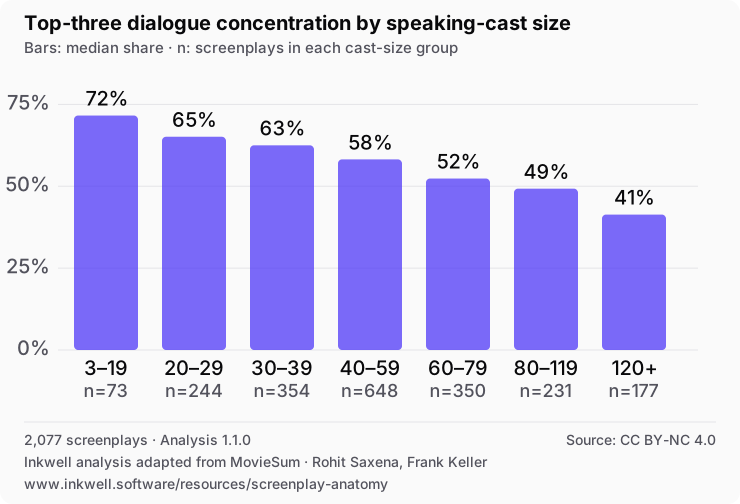
As the number of speaking characters grows, the three busiest voices usually account for less of the dialogue. The −0.523 score measures how consistently those two things move in opposite directions; it is not a quality score.
Movement across the draft
Picture each screenplay as ten equal stretches of story text. Action accounts for a median 63.8% in the first stretch, settles near 54.5% around halfway, and reaches 66.1% in the final stretch. The shaded range stays wide: many scripts depart sharply from this contour.
We split every script into ten equal stretches of story text. The line is the middle script; the shaded band contains the middle half.
Line: median · Shading: 25th–75th percentile
Choose a range, or tap or hover the chart, to inspect exact values.
| Progress | 25th percentile | Median | 75th percentile |
|---|---|---|---|
| 0–10% | 52.6% | 63.8% | 74.3% |
| 10–20% | 43.9% | 55.7% | 66.0% |
| 20–30% | 44.7% | 55.1% | 66.6% |
| 30–40% | 43.6% | 54.7% | 65.8% |
| 40–50% | 43.1% | 54.5% | 65.3% |
| 50–60% | 44.4% | 54.5% | 66.2% |
| 60–70% | 44.5% | 55.7% | 67.3% |
| 70–80% | 44.5% | 56.3% | 68.5% |
| 80–90% | 47.3% | 59.9% | 73.3% |
| 90–100% | 54.0% | 66.1% | 78.5% |
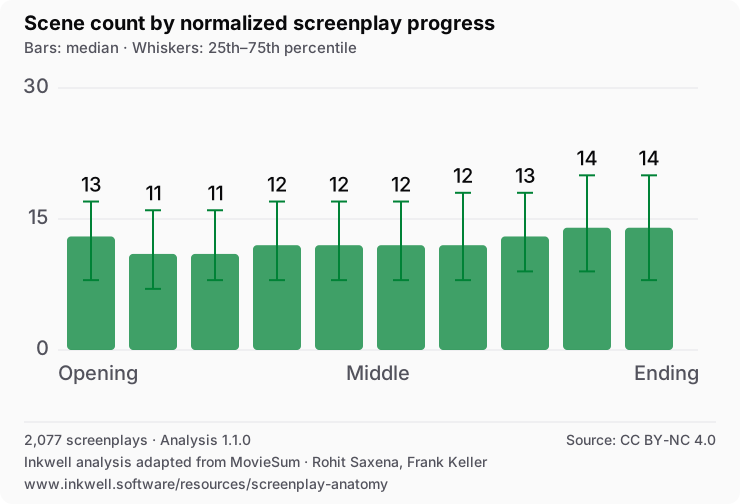
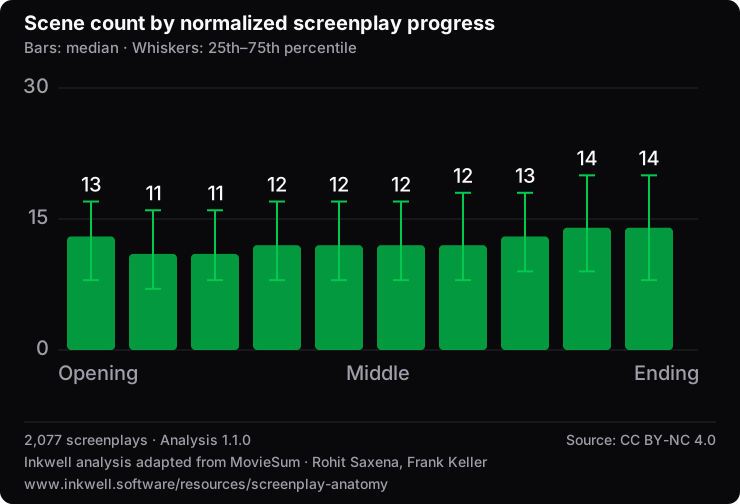
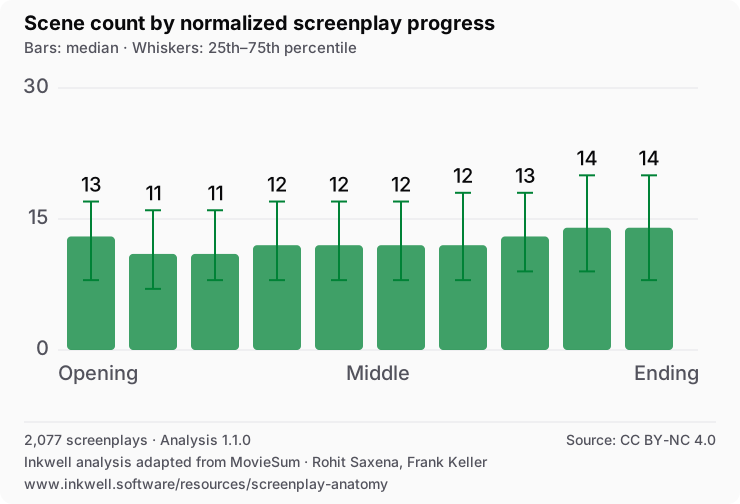
Each bar counts how many scenes fit inside an equal amount of story text. A taller bar means shorter scenes on average—not a longer section.
Bars: median · Whiskers: 25th–75th percentile
Choose a range, or tap or hover the chart, to inspect exact values.
| Progress | 25th percentile | Median | 75th percentile |
|---|---|---|---|
| 0–10% | 8 | 13 | 17 |
| 10–20% | 7 | 11 | 16 |
| 20–30% | 8 | 11 | 16 |
| 30–40% | 8 | 12 | 17 |
| 40–50% | 8 | 12 | 17 |
| 50–60% | 8 | 12 | 17 |
| 60–70% | 8 | 12 | 18 |
| 70–80% | 9 | 13 | 18 |
| 80–90% | 9 | 14 | 20 |
| 90–100% | 8 | 14 | 20 |
Scene count supplies a second signal. Each bucket contains the same share of narrative words, yet the median ending contains 14 scenes versus 12 near the midpoint. In this representation, the ending is composed of more, shorter scenes. It does not establish faster screen time or editing pace, which require the finished film.
Character arrival
Divide a script into ten equal stretches of story text. In the middle script, only 21.7% of everyone who will eventually speak has appeared after the first stretch. That reaches 65.0% by halfway and 94.4% by the end of the ninth.
Supporting and one-line roles count, so this does not mean protagonists arrive late. It means a blanket “introduce the whole cast immediately” rule does not describe what these scripts actually do.
By each tenth, what share of everyone who will eventually speak has appeared? One-line roles count too.
Line: median · Shading: 25th–75th percentile
Choose a range, or tap or hover the chart, to inspect exact values.
| Progress | 25th percentile | Median | 75th percentile |
|---|---|---|---|
| 0–10% | 16.1% | 21.7% | 28.1% |
| 10–20% | 28.8% | 35.7% | 44.4% |
| 20–30% | 38.8% | 46.5% | 55.6% |
| 30–40% | 48.5% | 56.0% | 64.6% |
| 40–50% | 57.3% | 65.0% | 73.1% |
| 50–60% | 65.9% | 73.4% | 80.3% |
| 60–70% | 74.1% | 80.6% | 86.6% |
| 70–80% | 82.5% | 87.7% | 92.5% |
| 80–90% | 90.9% | 94.4% | 97.4% |
| 90–100% | 100.0% | 100.0% | 100.0% |
Dialogue center of gravity
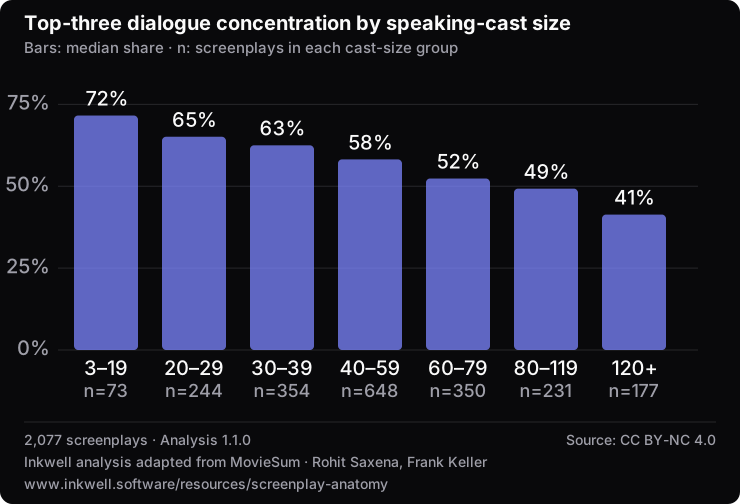
In the middle screenplay, the three most talkative characters deliver 57.2% of all dialogue. In scripts with fewer than 20 speaking characters, they carry about 72%; in scripts with 120 or more, that falls to about 41%.
The practical question is not whether a large cast is “wrong.” It is whether the reader can still tell whose choices are driving the scene. The underlying rank score is −0.523; it describes a pattern, not dramatic effectiveness.
Within each cast-size group, what share of all dialogue belongs to its three most talkative characters?
Bars: median share · n: screenplays in each cast-size group
Choose a range, or tap or hover the chart, to inspect exact values.
| Speaking characters | Scripts | Median top-three share |
|---|---|---|
| 3–19 | 73 | 71.6% |
| 20–29 | 244 | 65.1% |
| 30–39 | 354 | 62.5% |
| 40–59 | 648 | 58.2% |
| 60–79 | 350 | 52.4% |
| 80–119 | 231 | 49.3% |
| 120+ | 177 | 41.3% |
Corpus anatomy
The center marker is the median: half the included scripts fall above it and half below. The wider bar holds the middle half of scripts. These are word and scene counts, not page counts, because MovieSum does not preserve stable pagination.
Narrative words
Scenes
Typical scene length (words)
Speaking characters
Story held in longest 10% of scenes
Scenes with no dialogue
The last two measures come directly from scene content. In the median script, the longest tenth of scenes carries 38% of all action-and-dialogue words, while 29% of scenes contain no tagged dialogue. They reveal concentration and silence—not whether those choices work.
What a plot summary leaves behind
The median summary keeps only 3.02% of the screenplay’s counted words. That reduction removes performance, staging, rhythm, and most scene-level cause-and-effect. The numbers below help explain what summaries discard; they should not be used to judge screenplay craft.
For scale, the median screenplay contains 20,759 narrative words and its summary contains 656. Longer scripts do not reliably receive proportionally longer summaries.
Unique summary phrases absent from the screenplay
“Absent” means the exact word sequence does not appear in the screenplay. That can be useful paraphrase or an error; this test cannot tell which. The takeaway is simpler: summaries frequently describe events in language the screenplay itself never uses.
Methodology and boundaries
We kept scripts with enough material to compare reliably: at least 20 scenes, 5,000 action-and-dialogue words, three speaking characters, and 20 dialogue blocks.
Each script becomes ten equal stretches of story text, from first scene to last. Every screenplay gets one vote, so a very long script cannot overpower the rest.
This is not a sample of every working screenplay. Word position is not page count or screen time, and a common pattern is not automatically a good choice.
Charts use medians and observed quartiles rather than assuming a bell curve. The downloadable data also includes deterministic 95% bootstrap intervals, rank correlations, and log-normal fit checks.
We inspected 2,200 records, included 2,077, and excluded 123. Exclusion counts can overlap when one file misses more than one threshold.
Analysis version 1.1.0 records the thresholds, random seed, and source fingerprint in the aggregate JSON. No screenplay text, summaries, IMDb identifiers, or title-level measurements are served.
Work with the measurements
Open a table in a spreadsheet, compare its quantiles, or build another view of the same measurements. The complete JSON retains the correlations, fit diagnostics and methodology alongside these tables.
Action share, scenes per normalized tenth and cumulative speaking-cast arrival, with empirical quantiles and published median intervals.
30 measurement rows · Analysis 1.1.0
2,077 eligible screenplays. Cast-bin counts appear beside each measure; finite observation counts for individual statistics are not published.
| Measure | P10 | P25 | Median | P75 | P90 | Median interval low | Median interval high |
|---|---|---|---|---|---|---|---|
| Action word sharefraction · 0–10% | 0.4186 | 0.5257 | 0.6382 | 0.743 | 0.8262 | 0.6318 | 0.6486 |
| Scenes per normalized tenthscenes · 0–10% | 5 | 8 | 13 | 17 | 23 | 12 | 13 |
| Speaking cast introducedfraction · 0–10% | 0.1247 | 0.1613 | 0.2174 | 0.2807 | 0.3571 | 0.2121 | 0.2211 |
| Action word sharefraction · 10–20% | 0.3419 | 0.439 | 0.5573 | 0.6598 | 0.755 | 0.5501 | 0.566 |
| Scenes per normalized tenthscenes · 10–20% | 5 | 7 | 11 | 16 | 21 | 11 | 11 |
| Speaking cast introducedfraction · 10–20% | 0.2338 | 0.2885 | 0.3571 | 0.4444 | 0.5202 | 0.3511 | 0.3636 |
| Action word sharefraction · 20–30% | 0.3339 | 0.4471 | 0.5514 | 0.6657 | 0.7656 | 0.5434 | 0.5607 |
| Scenes per normalized tenthscenes · 20–30% | 5 | 8 | 11 | 16 | 22 | 11 | 12 |
| Speaking cast introducedfraction · 20–30% | 0.3333 | 0.3881 | 0.4651 | 0.5556 | 0.6414 | 0.4603 | 0.4727 |
| Action word sharefraction · 30–40% | 0.3418 | 0.4361 | 0.5474 | 0.6584 | 0.7612 | 0.5389 | 0.5569 |
| Scenes per normalized tenthscenes · 30–40% | 5 | 8 | 12 | 17 | 23 | 11 | 12 |
| Speaking cast introducedfraction · 30–40% | 0.4245 | 0.4848 | 0.56 | 0.6458 | 0.7253 | 0.5541 | 0.5667 |
| Action word sharefraction · 40–50% | 0.3345 | 0.4314 | 0.5447 | 0.6535 | 0.7569 | 0.5351 | 0.5535 |
| Scenes per normalized tenthscenes · 40–50% | 5 | 8 | 12 | 17 | 22.4 | 11 | 12 |
| Speaking cast introducedfraction · 40–50% | 0.5152 | 0.5726 | 0.65 | 0.7308 | 0.8046 | 0.6429 | 0.6552 |
| Action word sharefraction · 50–60% | 0.3396 | 0.444 | 0.5446 | 0.6617 | 0.7669 | 0.5375 | 0.5529 |
| Scenes per normalized tenthscenes · 50–60% | 5 | 8 | 12 | 17 | 23 | 12 | 12 |
| Speaking cast introducedfraction · 50–60% | 0.6026 | 0.6591 | 0.7339 | 0.8033 | 0.8681 | 0.7292 | 0.7407 |
| Action word sharefraction · 60–70% | 0.3411 | 0.4455 | 0.5572 | 0.6734 | 0.7703 | 0.5506 | 0.5654 |
| Scenes per normalized tenthscenes · 60–70% | 5 | 8 | 12 | 18 | 24 | 12 | 13 |
| Speaking cast introducedfraction · 60–70% | 0.68 | 0.7407 | 0.8056 | 0.8661 | 0.92 | 0.8 | 0.8107 |
| Action word sharefraction · 70–80% | 0.3381 | 0.4449 | 0.5629 | 0.6845 | 0.7966 | 0.5522 | 0.5755 |
| Scenes per normalized tenthscenes · 70–80% | 5 | 9 | 13 | 18 | 25 | 12 | 13 |
| Speaking cast introducedfraction · 70–80% | 0.7725 | 0.8246 | 0.8772 | 0.925 | 0.963 | 0.8718 | 0.881 |
| Action word sharefraction · 80–90% | 0.3599 | 0.4735 | 0.5987 | 0.7327 | 0.8291 | 0.5879 | 0.6102 |
| Scenes per normalized tenthscenes · 80–90% | 5 | 9 | 14 | 20 | 27 | 13 | 14 |
| Speaking cast introducedfraction · 80–90% | 0.8684 | 0.9091 | 0.9444 | 0.9737 | 1 | 0.9412 | 0.9467 |
| Action word sharefraction · 90–100% | 0.4194 | 0.5402 | 0.6608 | 0.7848 | 0.8655 | 0.6481 | 0.6696 |
| Scenes per normalized tenthscenes · 90–100% | 5 | 8 | 14 | 20 | 28 | 13 | 14 |
| Speaking cast introducedfraction · 90–100% | 1 | 1 | 1 | 1 | 1 | 1 | 1 |
Script and summary lengths, scene and cast counts, concentration, compression and novel summary phrases. Each row summarizes one measure across the corpus.
15 measurement rows · Analysis 1.1.0
2,077 eligible screenplays. Cast-bin counts appear beside each measure; finite observation counts for individual statistics are not published.
| Measure | P10 | P25 | Median | P75 | P90 | Median interval low | Median interval high |
|---|---|---|---|---|---|---|---|
| Narrative wordswords · Whole corpus | 15871.6 | 18380 | 21579 | 25179 | 29019.4 | — | — |
| Tokenized narrative wordswords · Whole corpus | 15476.4 | 17908 | 20759 | 23715 | 27087.2 | — | — |
| Scene countscenes · Whole corpus | 68 | 97 | 130 | 168 | 211 | — | — |
| Median scene lengthwords · Whole corpus | 52.5 | 70 | 94 | 132 | 189 | — | — |
| Longest tenth of scenesfraction · Whole corpus | 0.317 | 0.3455 | 0.3792 | 0.4199 | 0.4615 | — | — |
| Dialogue-free scenesfraction · Whole corpus | 0.1329 | 0.2027 | 0.2945 | 0.3852 | 0.4697 | — | — |
| Speaking-character countcharacters · Whole corpus | 26 | 36 | 50 | 72 | 110 | — | — |
| Action word sharefraction · Whole corpus | 0.3957 | 0.4859 | 0.579 | 0.6751 | 0.7398 | — | — |
| Top-three dialogue sharefraction · Whole corpus | 0.3979 | 0.4798 | 0.5718 | 0.6603 | 0.7354 | — | — |
| Scene-heading coveragefraction · Whole corpus | 0.9863 | 0.9913 | 0.9947 | 1 | 1 | — | — |
| Summary wordswords · Whole corpus | 410.6 | 538 | 656 | 714 | 801.4 | — | — |
| Summary compression ratiofraction · Whole corpus | 0.019 | 0.025 | 0.0302 | 0.0366 | 0.0443 | — | — |
| Novel summary wordsfraction · Whole corpus | 0.242 | 0.2718 | 0.3056 | 0.3426 | 0.3784 | — | — |
| Novel two-word summary phrasesfraction · Whole corpus | 0.6727 | 0.6993 | 0.726 | 0.7557 | 0.7824 | — | — |
| Novel three-word summary phrasesfraction · Whole corpus | 0.9236 | 0.9378 | 0.9511 | 0.9627 | 0.9717 | — | — |
Speaking-character counts and the three busiest voices' dialogue share within each published cast-size bin, retaining its script count.
14 measurement rows · Analysis 1.1.0
2,077 eligible screenplays. Cast-bin counts appear beside each measure; finite observation counts for individual statistics are not published.
| Measure | P10 | P25 | Median | P75 | P90 | Median interval low | Median interval high |
|---|---|---|---|---|---|---|---|
| Speaking-character countcharacters · 3–1973 scripts in this bin | 9.2 | 13 | 15 | 17 | 19 | — | — |
| Top-three dialogue sharefraction · 3–1973 scripts in this bin | 0.5947 | 0.6555 | 0.7159 | 0.8308 | 0.9197 | — | — |
| Speaking-character countcharacters · 20–29244 scripts in this bin | 21 | 23 | 26 | 27 | 29 | — | — |
| Top-three dialogue sharefraction · 20–29244 scripts in this bin | 0.5107 | 0.5771 | 0.6511 | 0.7365 | 0.7982 | — | — |
| Speaking-character countcharacters · 30–39354 scripts in this bin | 31 | 33 | 35 | 37 | 38.7 | — | — |
| Top-three dialogue sharefraction · 30–39354 scripts in this bin | 0.482 | 0.5346 | 0.625 | 0.6986 | 0.7554 | — | — |
| Speaking-character countcharacters · 40–59648 scripts in this bin | 41 | 44.75 | 49 | 54 | 57 | — | — |
| Top-three dialogue sharefraction · 40–59648 scripts in this bin | 0.4277 | 0.5023 | 0.582 | 0.6579 | 0.7178 | — | — |
| Speaking-character countcharacters · 60–79350 scripts in this bin | 61 | 63 | 69 | 73 | 77 | — | — |
| Top-three dialogue sharefraction · 60–79350 scripts in this bin | 0.3988 | 0.4567 | 0.5236 | 0.6016 | 0.6759 | — | — |
| Speaking-character countcharacters · 80–119231 scripts in this bin | 81 | 86 | 95 | 104 | 113 | — | — |
| Top-three dialogue sharefraction · 80–119231 scripts in this bin | 0.3543 | 0.4099 | 0.4927 | 0.5664 | 0.6284 | — | — |
| Speaking-character countcharacters · 120+177 scripts in this bin | 125 | 136 | 164 | 235 | 312.4 | — | — |
| Top-three dialogue sharefraction · 120+177 scripts in this bin | 0.2671 | 0.3427 | 0.4135 | 0.4914 | 0.5769 | — | — |
For local analysis, save a CSV and its table dictionary in the same folder, keeping both filenames. The complete table metadata describes all three CSVs together.
Shares are fractions from 0 to 1; multiply by 100 to display a percentage.
P25–P75 describes variation between screenplays. The 95% interval estimates uncertainty in a median; it is not a range containing 95% of scripts. Blank interval cells mean no interval was published, not zero.
Corpus scripts counts eligible screenplays, not the number of finite observations used for every statistic. Group scripts is published only for cast-size bins; per-tenth observation counts are not present in the source aggregate.
Measure the draft you actually have
Put one draft on these exact distributions with the pacing map—or use the screenplay analyzer for the scene, character, location, and dialogue shape of one draft, or compare two revisions without flattening the screenplay into a generic text diff.